Research
Response of Landfalling Atmospheric Rivers on the U.S. West Coast to Local Sea Surface Temperature Perturbations
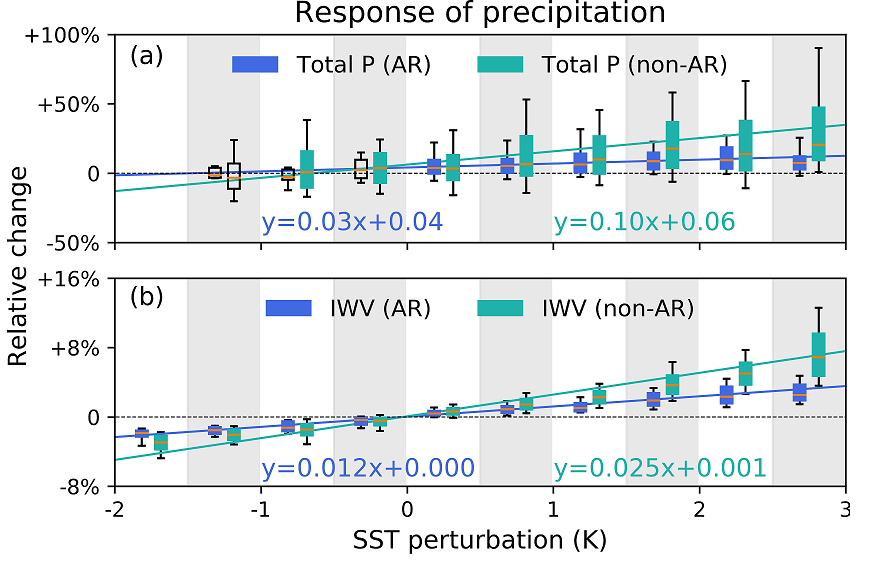
Atmospheric rivers (ARs) have important effects on extreme precipitation and flooding in the U.S. west coast. Local sea surface temperature (SST) may intensify ARs and their impacts by changing atmospheric temperature and moisture. This study compares two regional climate simulations of the western U.S. that differ only in the local SST. Analysis shows that local SST warming increases the frequency of ARs across the U.S. west coast as ARs expand to cover larger areas and more ARs emerge with increasing moisture. AR landfalling area, inland intrusion distance and intensity also increase. Although local SST warming only increases AR moisture by 0.4% /K, extreme precipitation associated with ARs increases by a much larger rate of 3% /K as SST warming intensifies storms. Hence local SST has important effects on ARs and extreme precipitation in the western U.S.
Read more
A Framework to Delineate Precipitation‐Runoff Regimes: Precipitation Versus Snowpack in the Western United States
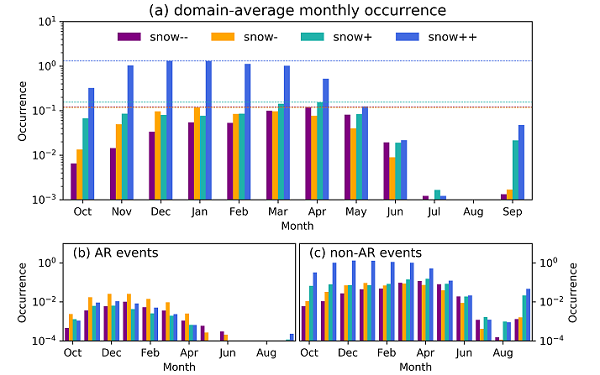
Snowpack accumulation/ablation affects the runoff response to precipitation by modulating the water flux reaching the surface. Previous studies mostly focused on “rain‐on‐snow” events. Here we propose a framework to extend the scope and classify precipitation events accompanied by snow accumulation/ablation (precipitation‐and‐snow, or PAS, events) into five regimes. This framework is applied to a regional climate simulation over the western United States for 1981–2015 to reveal regions where daily changes in snowpack alter the surface hydrologic responses to precipitation. Over the western United States, PAS events account for 50–90% of all the precipitation events. Compared to the broad spatial distribution of snow accumulation‐type PAS events, snowmelting‐type PAS events are limited to coastal high‐elevation areas. Atmospheric rivers, a key driver of heavy precipitation in the region, account for only 2% of the PAS events, but they trigger significant snowmelt, accounting for 20% and 11% of light and heavy snowmelting events, respectively.
Read more
Impact of Atmospheric Rivers on Surface Hydrological Processes in Western U.S. Watersheds
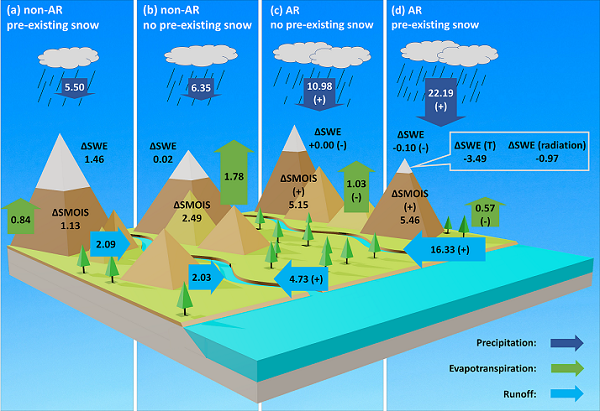
Atmospheric rivers (ARs) can significantly modulate surface hydrological processes through the extreme precipitation they produce. However, there is a lack of comprehensive evaluation of ARs' impact on surface hydrology. This study uses a high‐resolution regional climate simulation to quantify the impact of ARs on surface hydrological processes across the western U.S. watersheds. Our analysis indicates that ARs produce heavy precipitation but suppress evapotranspiration. Snowpack ablates more during ARs, with higher air temperature and increased longwave radiation playing the primary and secondary roles, respectively. At the 0 °C to 10 °C temperature range, ARs increase the probability of snow ablation from 0.33 to 0.57. The runoff‐to‐precipitation ratio is primarily controlled by antecedent soil moisture, but it almost doubles in the northwestern watersheds due to the intensification of snow ablation during AR events. From the analysis of the relationship between the hydrological responses and different meteorological factors, precipitation, temperature, and radiation are identified as the key drivers that distinguish the hydrologic responses between AR and non‐AR events. We also found that ARs explain 30% to 60% of the variability of annual total runoff and sharpen the seasonality of water resources availability in the west coast mountain watersheds.
Read more
Predictability of Extreme Precipitation in Western U.S. Watersheds Based on Atmospheric River Occurrence, Intensity, and Duration
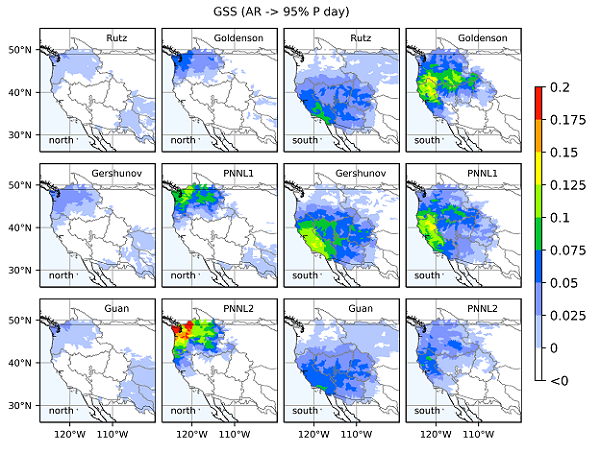
Atmospheric rivers (ARs) are the elongated atmospheric bands that transport huge amount of water vapor toward the poles. Various studies have attributed ARs as a major cause of extreme precipitation and thus flooding in the western United States, but the reverse question is seldom investigated: when there is an AR, what is the likelihood of having an extreme precipitation event? In our study, we show that ARs can be used to predict the occurrence of extreme precipitation events at daily scale. We also show that the intensity of ARs is well correlated with extreme precipitation amount at a monthly scale. The results suggest that extreme precipitation prediction can potentially benefit from AR forecasts, which have a longer lead time than precipitation forecasts. Regarding the vast amount of ARs as identified from various AR‐tracking algorithms, we used a machine learning‐based approach to highlight ARs that are strongly correlated with hydrological extreme events. These ARs usually feature long duration or high intensity, and focusing on them may reveal a clearer and most robust relationship between ARs and hydrological extreme events.
Read more
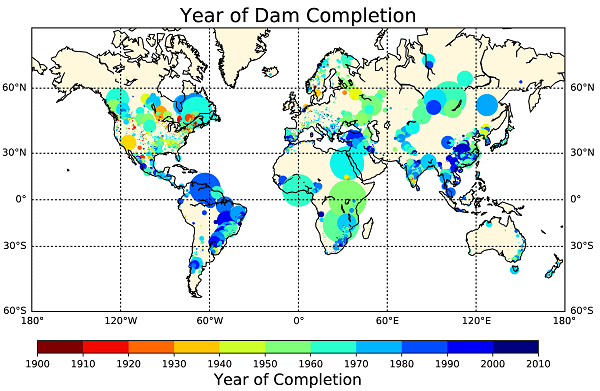
Understanding future safety of dams in a changing climate
The safety of critical water infrastructures such as dams that are upstream of population centers and aging is gaining attention due to rapid change to landscape, climate and society. In general, Probable Maximum Precipitation (PMP) is used in the design to ensure public safety of such critical water infrastructures. We demonstrate an approach where PMP can be derived from combining traditional engineering practice and modern climate science. Using the US Pacific Northwest as an example, PMP was computed from an ensemble of earth system models and verified against historical values already used in the design of the aging water infrastructures. Our engineeringclimate science approach indicates that PMP in the PNW is likely to increase by 2099 significantly compared to current estimates under a climate change scenario (RCP 8.5), mandating the need for a reevaluation of safety and resilience of these critical infrastructure now rather than later, at least in the US Pacific Northwest.
Read more
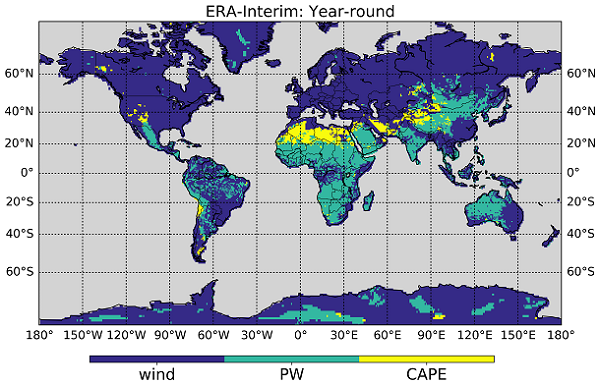
Understanding model-based probable maximum precipitation estimation as a function of location and season from atmospheric reanalysis
Extreme precipitation events bring huge societal and economic loss around the world every year, and they have undergone spatially heterogeneous changes in the past half-century. They are fundamental to probable maximum precipitation (PMP) estimation in engineering practice, making it important to understand how extreme storm magnitudes are related to key meteorological conditions. However, there is currently a lack of information that can potentially inform the engineering profession on the controlling factors for PMP estimation. In this study, the authors present a statistical analysis of the relationship between extreme 3-day precipitation and atmospheric instability, moisture availability, and large-scale convergence over the continental United States (CONUS). The analysis is conducted using the North America Regional Reanalysis (NARR) and ECMWF ERA-Interim reanalysis data and a high-resolution regional climate simulation. While extreme 3-day precipitation events across the CONUS are mostly related to vertical velocity and moisture availability, those in the southwestern U.S. mountain regions are also controlled by atmospheric instability. Vertical velocity and relative humidity have domainwide impacts, while no significant relationship is found between extreme precipitation and air temperature. Such patterns are stable over different seasons and extreme precipitation events of various durations between 1 and 3 days. These analyses can directly help in configuring the numerical models for PMP estimation at a given location for a given storm.
Read more
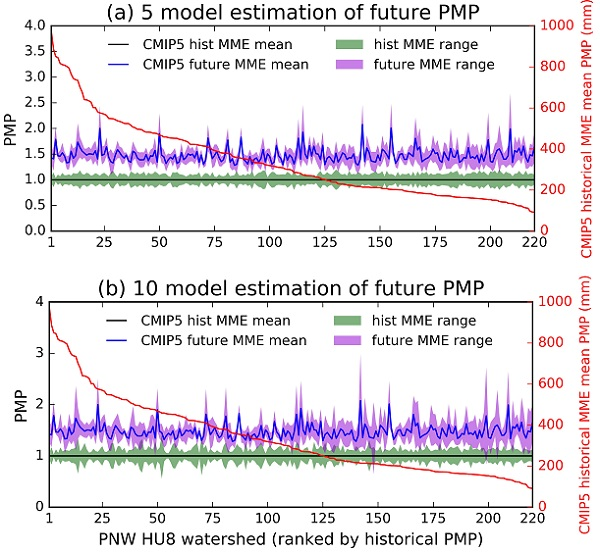
Probable maximum precipitation in the U.S. Pacific Northwest in a changing climate
The safety of large and aging water infrastructures is gaining attention in water management given the accelerated rate of change in landscape, climate, and society. In current engineering practice, such safety is ensured by the design of infrastructure for the Probable Maximum Precipitation (PMP). Recently, several numerical modeling approaches have been proposed to modernize the conventional and ad hoc PMP estimation approach. However, the underlying physics have not been fully investigated and thus differing PMP estimates are sometimes obtained without physics‐based interpretations. In this study, we present a hybrid approach that takes advantage of both traditional engineering practice and modern climate science to estimate PMP for current and future climate conditions. The traditional PMP approach is modified and applied to five statistically downscaled CMIP5 model outputs, producing an ensemble of PMP estimates in the Pacific Northwest (PNW) during the historical (1970–2016) and future (2050–2099) time periods. The hybrid approach produced consistent historical PMP estimates as the traditional estimates. PMP in the PNW will increase by 50% ± 30% of the current design PMP by 2099 under the RCP8.5 scenario. Most of the increase is caused by warming, which mainly affects moisture availability through increased sea surface temperature, with minor contributions from changes in storm efficiency in the future. Moist track change tends to reduce the future PMP. Compared with extreme precipitation, PMP exhibits higher internal variability. Thus, long‐time records of high‐quality data in both precipitation and related meteorological fields (temperature, wind fields) are required to reduce uncertainties in the ensemble PMP estimates.
Read more
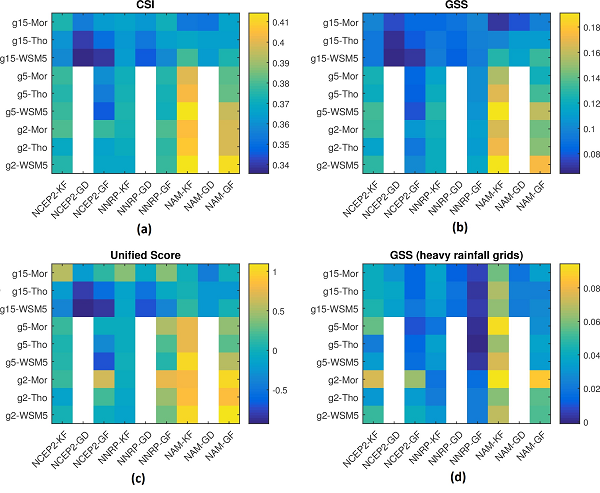
Establishing a numerical modeling framework for hydrologic engineering analyses of extreme storm events
In this study, a numerical modeling framework for simulating extreme storm events was established using the Weather Research and Forecasting (WRF) model. Such a framework is necessary for the derivation of engineering parameters such as probable maximum precipitation that are the cornerstone of large water-management infrastructure design. Here, this framework was built based on a heavy storm that occurred in Nashville, Tennessee (U.S.), in 2010, and verified using two other extreme storms. To achieve the optimal setup, several combinations of model resolutions, initial/boundary conditions (IC/BC), cloud microphysics, and cumulus parameterization schemes were evaluated using multiple metrics of precipitation characteristics. The evaluation suggests that WRF is most sensitive to the IC/BC option. Simulation generally benefits from finer resolutions up to 5 km. At the 15 km level, NCEP2 IC/BC produces better results, whereas NAM IC/BC performs best at the 5 km level. The recommended model configuration from this study is: NAM or NCEP2 IC/BC (depending on data availability), 15 km or 15–5 km nested grids, Morrison microphysics, and Kain-Fritsch cumulus schemes. Validation of the optimal framework suggests that these options are good starting choices for modeling extreme events similar to the test cases. This optimal framework is proposed in response to emerging engineering demands of extreme storm event forecasting and analyses for design, operations, and risk assessment of large water infrastructures.
Read more
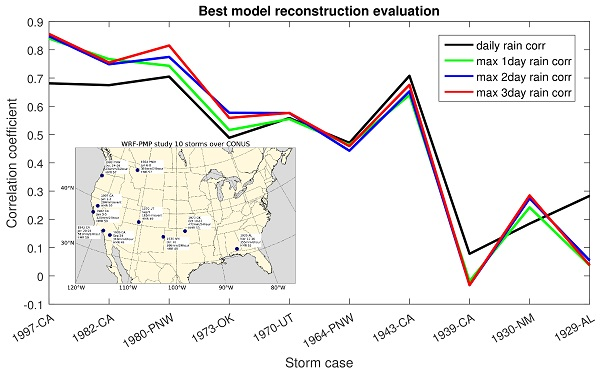
Revisiting extreme storms of the past 100 years for future safety of large water management infrastructures
Historical extreme storm events are widely used to make Probable Maximum Precipitation (PMP) estimates, which form the cornerstone of large water management infrastructure safety. Past studies suggest that extreme precipitation processes can be sensitive to land surface feedback and the planetary warming trend, which makes the future safety of large infrastructures questionable given the projected changes in land cover and temperature in the coming decades. In this study, a numerical modeling framework was employed to reconstruct 10 extreme storms over CONUS that occurred during the past 100 years, which are used by the engineering profession for PMP estimation for large infrastructures such as dams. Results show that the correlation in daily rainfall for such reconstruction can range between 0.4 and 0.7, while the correlation for maximum 3‐day accumulation (a standard period used in infrastructure design) is always above 0.5 for post‐1948 storms. This suggests that current numerical modeling and reanalysis data allow us to reconstruct big storms after 1948 with acceptable accuracy. For storms prior to 1948, however, reconstruction of storms shows inconsistency with observations. Our study indicates that numerical modeling and data may not have advanced to a sufficient level to understand how such old storms (pre‐1948) may behave in future warming and land cover conditions. However, the infrastructure community can certainly rely on the use of model reconstructed extreme storms of the 1948‐present period to reassess safety of our large water infrastructures under assumed changes in temperature and land cover.
Read more
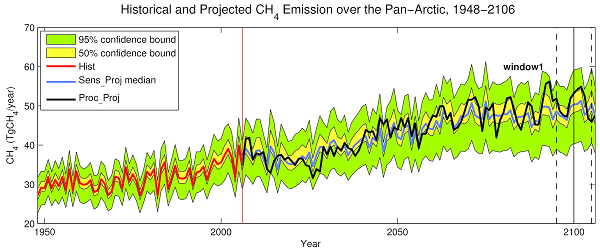
Model estimates of climate controls on pan-Arctic wetland methane emissions
Climate factors including soil temperature and moisture, incident solar radiation, and atmospheric carbon dioxide concentration are important environmental controls on methane (CH4) emissions from northern wetlands. We investigated the spatiotemporal distributions of the influence of these factors on northern high-latitude wetland CH4 emissions using an enhanced version of the Variable Infiltration Capacity (VIC) land surface model. We simulated CH4 emissions from wetlands across the pan-Arctic domain over the period 1948–2006, yielding annual average emissions of 36.1 ± 6.7 Tg CH4 yr−1 for the period 1997–2006. We characterized historical sensitivities of CH4 emissions to air temperature, precipitation, incident long- and shortwave radiation, and atmospheric [CO2] as a function of average summer air temperature and precipitation. Emissions from relatively warm and dry wetlands in the southern (permafrost-free) portion of the domain were positively correlated with precipitation and negatively correlated with air temperature, while emissions from wetter and colder wetlands further north (permafrost) were positively correlated with air temperature. Over the entire period 1948–2006, our reconstructed CH4 emissions increased by 20 %, the majority of which can be attributed to an increasing trend in summer air temperature. We estimated future emissions in response to 21st century warming as predicted by CMIP5 (Coupled Model Intercomparison Project Phase 5) model projections to result in end-of-century CH4 emissions 38–53 % higher than our reconstructed 1997–2006 emissions, accompanied by the northward migration of warmer and drier than optimal conditions for CH4 emissions, implying a reduced role for temperature in driving future increases in emissions.
Read more